
Ecology calculation questions in the British Biology Olympiad (BBO) test more than arithmetic. Many students can plug numbers into the Lincoln index and produce a value, yet still miss the biological point because they never ask whether that value is biologically meaningful. Assumption breaches can turn a correct-looking calculation into a misleading estimate — a storm during the study, a bait station that only certain animals visit, or a tag that changes how conspicuous an animal is to predators. The number still comes out of the formula, but the number may be wrong if the method’s assumptions are not met. This guide helps you check those assumptions so that the calculation and the interpretation both rest on a defensible biological argument.
Why mark-release-recapture appears in BBO ecology
Population estimation sits within ecology because it forces three skills together: reading a method description, applying a proportional-reasoning formula, and reasoning about how the real world breaks the idealised model. A standard teaching scenario involves a researcher capturing a set of animals, marking them, releasing them, waiting, then catching a second sample and counting how many carry marks. The exercise then asks for an estimate of population size and may ask for a comment on the reliability of that estimate. The arithmetic is short. The reasoning is where the biological meaning is decided.
Compared with allele-frequency questions, mark-release-recapture is messier because the population is a physical group of animals that can move, die, learn, or be eaten. Where a Hardy-Weinberg question checks whether allele frequencies are stable, a mark-release-recapture question checks whether a proportion is representative — and proportions only represent the whole when the sampling is fair.
The Lincoln index and its logic
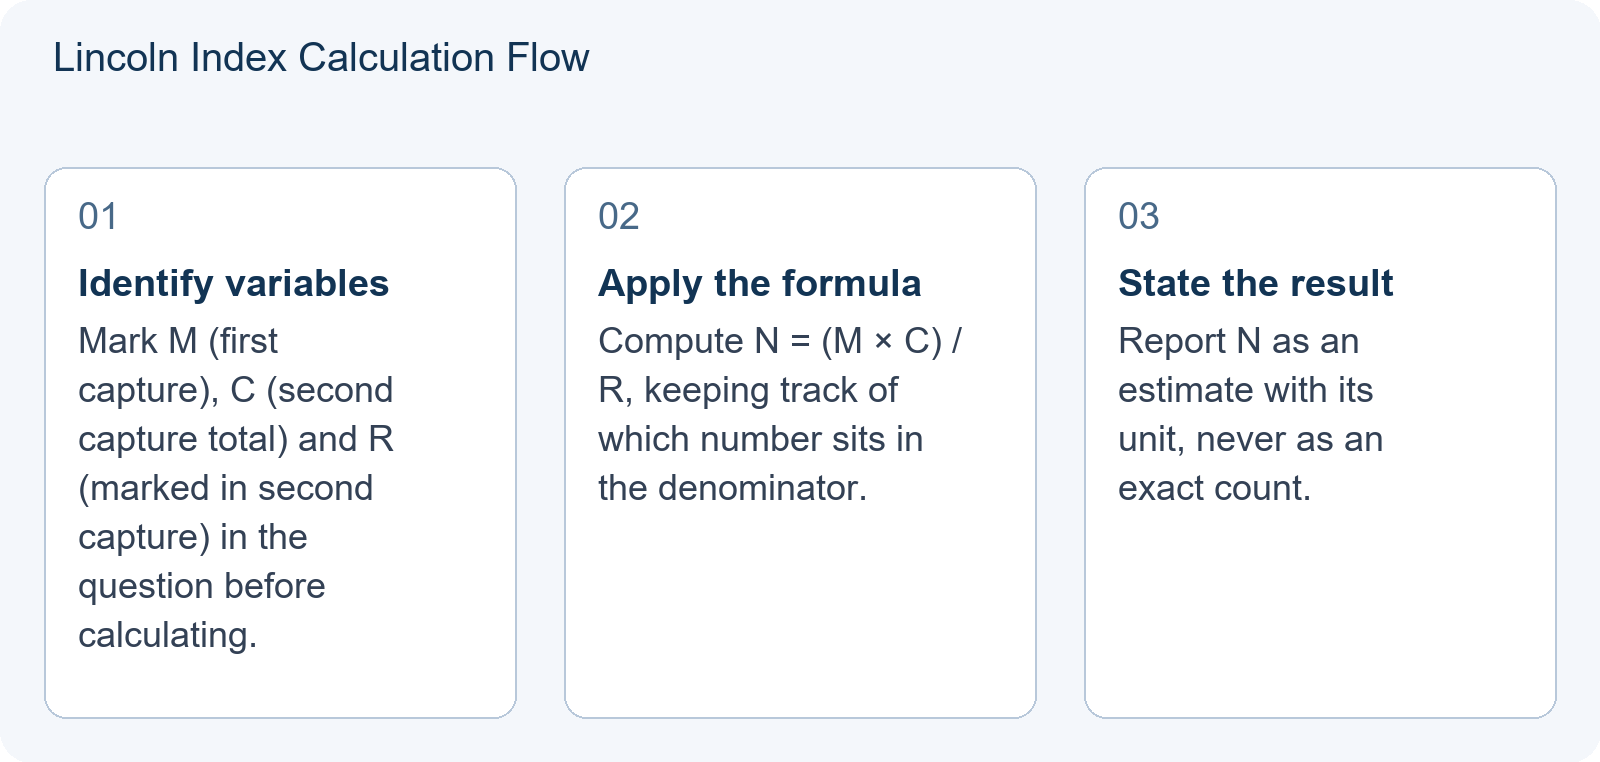
The Lincoln index, also called the Petersen estimator, rests on a single proportional statement: the fraction of marked animals in the second sample should equal the fraction of marked animals in the population.
N = (M × C) / R
Here N is the estimated population size, M is the number marked in the first sample, C is the total number captured in the second sample, and R is how many of that second sample carried a mark. If M out of N animals are marked, and the second sample is a fair snapshot, then R out of C should also be marked. Setting M/N equal to R/C and rearranging gives the formula above.
Two mistakes are common here. The first is confusing C with R — treating the total catch as the recapture count. The second is subtler: reading the question as an invitation to multiply, rather than as a test of proportionality. Writing M, C and R onto the page before touching the calculator removes most of the first error. The second only goes away if you genuinely check the assumptions before trusting the answer.
Three load-bearing assumptions
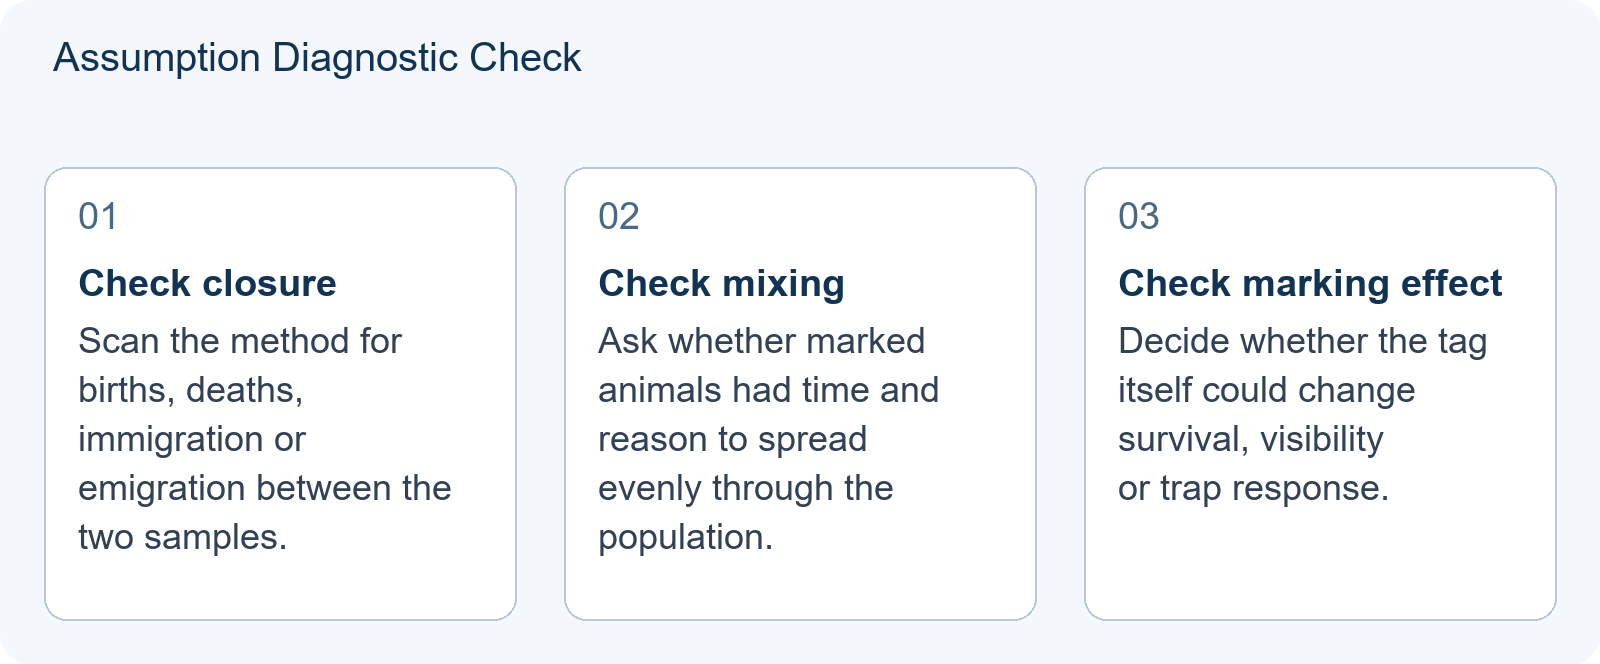
The Lincoln index provides a useful estimate only when three conditions hold. Break any one and the estimate tilts in a predictable direction.
Closed population. No births, deaths, immigration or emigration occur between the first and second sample. Tagged animals that die are no longer available to be recaptured, and immigration of unmarked animals dilutes the marked fraction.
Random mixing. Marked individuals distribute themselves evenly through the population before the second sample is taken. If they clump, stay near the release point, or avoid the second trap, the recapture count stops being representative.
No marking effect. The tag itself does not change an animal’s survival or behaviour. A fluorescent mark can make a small mammal more visible to owls; a fin clip can alter swimming performance; handling stress can make an individual avoid the trap afterwards.
Each assumption maps onto a specific variable. Violating the closed-population assumption or the no-marking-effect assumption usually distorts R. Violating random mixing distorts R too, but for a different reason: the sample itself is biased rather than the population changing size.
Diagnostic sequence for exam answers
Step one: read the method section slowly. Note the time interval, the habitat, the marking technique, and anything the text says about weather, predators or food supply. These details can determine whether an assumption holds.
Step two: check each of the three assumptions against what the text actually says. Does the timeline allow births or migration? Is the study area enclosed? Were marked animals released together at one point, or scattered? Does the marking description hint at pain, visibility or smell?
Step three: decide whether the estimate still answers the question. If an assumption is clearly breached, the arithmetic is still worth showing, but the answer is not the number. It is the number plus a statement of the direction the number has been pushed.
For example, if the text says heavy rain washed off external tags, you know R is artificially low. Since R sits in the denominator, a low R produces a high N. The estimate overstates the population.
Worked teaching illustration: ideal conditions
The following is a teaching illustration, not an actual BBO question. It simply shows what a clean calculation looks like before assumptions are bent.
A pond study catches 40 fish, marks them harmlessly with a small fin clip, and releases them. After a week of normal activity, a second net catches 50 fish, of which 8 carry the clip. Using the Lincoln index:
N = (40 × 50) / 8 = 2000 / 8 = 250
In this ideal scenario we assume no fish died or migrated, the clipped fish mixed evenly, and the clip did not change swimming or feeding behaviour. The estimate of 250 is what the method is designed to produce. It is not a count. It is a proportional inference, and it carries sampling error even under perfect conditions.
Worked teaching illustration: trap-happy bias
Now bend the same scenario. Suppose the fish learn that the net brings food. They become trap-happy, and marked fish are more likely to enter the second net than unmarked ones. In the second sample of 50, 20 carry marks instead of 8.
N = (40 × 50) / 20 = 2000 / 20 = 100
The estimate collapses from 250 to 100. This is not because the pond has shrunk. It is because R — the recapture count — was inflated by unequal catchability. Since R is in the denominator, an inflated R produces a deflated N. Trap-happy behaviour makes the population look smaller than it is.
Worked teaching illustration: trap-shy bias
The opposite bias appears when marked animals avoid the trap. Perhaps handling during the first capture made them cautious. In the same scenario, suppose only 4 of the second sample of 50 carry marks.
N = (40 × 50) / 4 = 2000 / 4 = 500
Now the estimate has more than doubled, because R was artificially suppressed. The population looks larger than it is. Trap-shyness and differential mortality produce the same directional bias for the same mathematical reason: both reduce the recapture count.
Phrasing answers when assumptions breach
The number matters, but in a comment-on-validity part of the question, the phrasing matters more. A reliable structure for the written answer has four parts:
- Give the calculated value using the numbers the question provided.
- Name the assumption that was breached, in the specific terms of the scenario — for example, the assumption of a closed population was not met because the text states three tagged animals were found dead.
- State the direction of bias in plain language: this will overestimate the true population because a lower recapture count inflates N.
- State the ecological conclusion in a way that respects the uncertainty: the actual abundance is probably lower than the estimate of 500.
Avoid claiming the estimate is a count. Avoid claiming assumptions must hold — they are stated assumptions, but a fieldwork description may include conditions that breach one of them. Also avoid the bare statement that the estimate is inaccurate, full stop. Precision about direction is what demonstrates understanding.
If you want practice stating assumptions before applying a formula, the companion articles on BBO Hardy-Weinberg Questions: Checking Assumptions Before Using the Equation and on BBO Experimental Controls: Separating a Fair Comparison From a Convincing Story use the same underlying logic and are useful side drills.
Common error: treating the estimate as a count
A frequent misconception is reading the Lincoln index output as a census. It is not. Even with perfect assumptions, different samples yield different estimates. Small values of R make the estimate especially unstable — if R is 1, tiny variations in sampling swing N wildly. While there is no universal threshold for a “good” R, estimators generally require sufficient recaptures to reduce variance. Extending the study or running multiple capture rounds reduces this variance, which is exactly why the more sophisticated estimators exist.
The safe phrasing in a written answer uses words like estimated at, approximately, or suggests a population of around. These are not hedging clichés; they are the correct language for a probabilistic estimate.
Preparation for mark-release-recapture questions
Rebuild practice questions rather than only solving them. Take a data table, write out M, C and R yourself, then write the assumption check before reaching for the calculator. Practising on BBO Past Papers: How to Use Them When Answers Are Not Enough builds the habit of reading the method section as carefully as the data. The diagnostic sequence above is best learned as a routine, not as an afterthought.
The same habit transfers to any fieldwork reasoning: identify the ideal model, identify how the scenario departs from it, and then state the direction the number has moved. That is the reasoning that keeps a fieldwork calculation biologically meaningful, and it stops the arithmetic from being wasted.
Frequently Asked Questions
What happens if marked animals die before recapture?
If marked animals have lower survival than unmarked ones, the recapture count R falls. Since R is in the denominator, a smaller R produces a larger N. Differential mortality therefore overestimates the true population size.
Is the Lincoln index suitable for mobile populations?
Not as stated. The basic Lincoln index assumes a closed population. If immigration or emigration is significant between sampling events, the marked proportion changes for reasons unrelated to population size. Open-population methods such as the Jolly-Seber estimator are needed instead, whereas Schnabel is a closed-population multiple-capture method.
Why does trap-shyness lead to overestimation?
Trap-shy marked animals avoid the second capture, which reduces the observed R. Dividing by a smaller R inflates N, so the calculated population appears larger than the real one — the marked cohort is underrepresented in the recapture sample.