
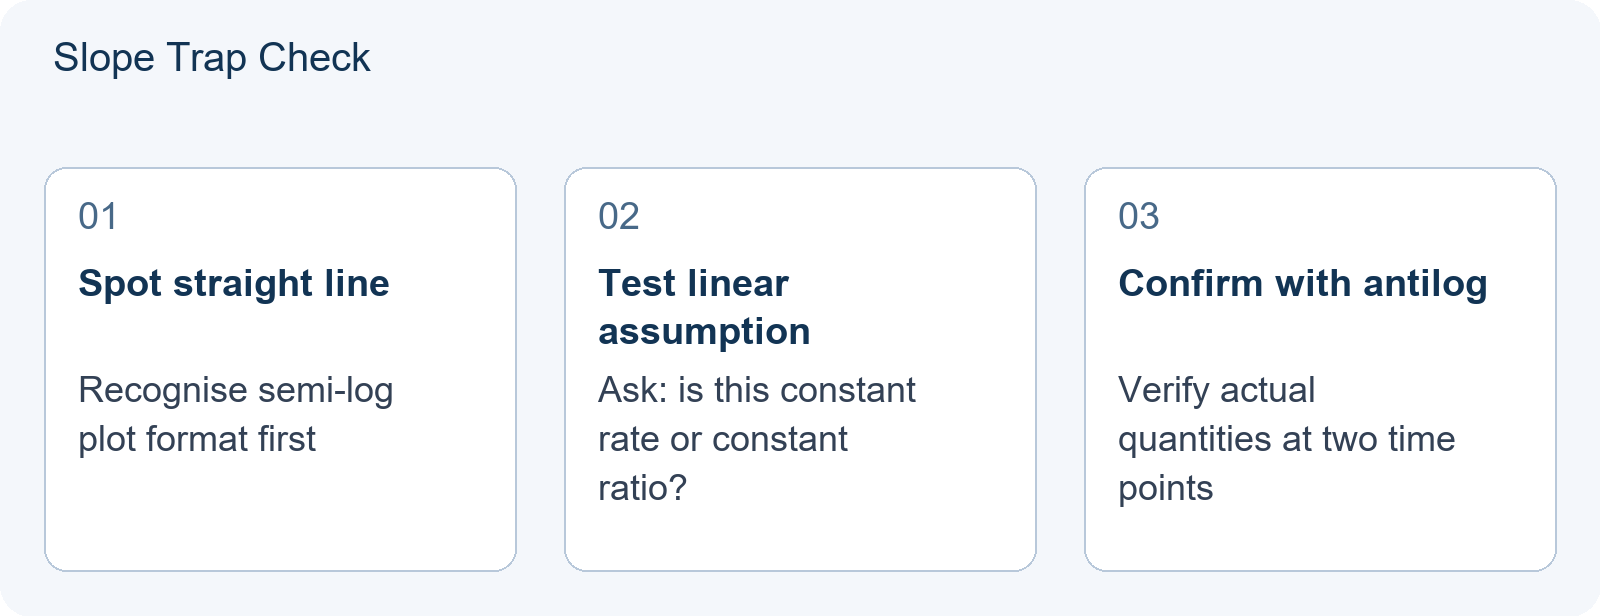
Logarithmic axes appear often in biology data about population growth and serial dilutions. The axis looks like ordinary graph paper, but the spacing encodes multiplication rather than addition. A student who treats it as linear will misread a doubling as just a small visual step and will fail to recognise that a straight line on a semi-log plot signals exponential, not constant, growth.
Why Biology Uses Log Scales
Biological processes span enormous ranges. A bacterial culture might grow from 10³ to 10⁹ cells in a day. Plotting this on linear paper squashes the early data into the bottom pixel and wastes most of the page. A log10 axis keeps every order of magnitude visible and comparable. The trade-off: equal distances now mean equal ratios, not equal differences.
In data-rich biology contexts, you will typically see log axes in:
- Population ecology: log(N) versus time to test exponential growth models
- Serial dilutions: plotting measured signal against log[dilution factor] to cover multiple orders of magnitude
- pH measurements: the pH scale itself is logarithmic, with each unit representing a tenfold change in hydrogen ion concentration
The skill required is not memorising the shape of a curve. It is reading the axis correctly under time pressure.
Teaching Illustration 1: Correct Reading
Scenario: A graph shows log10(bacterial count) on the y-axis against hours on the x-axis. The line rises from 3.0 at t = 0 to 5.0 at t = 4 hours.
Step-by-step reasoning:
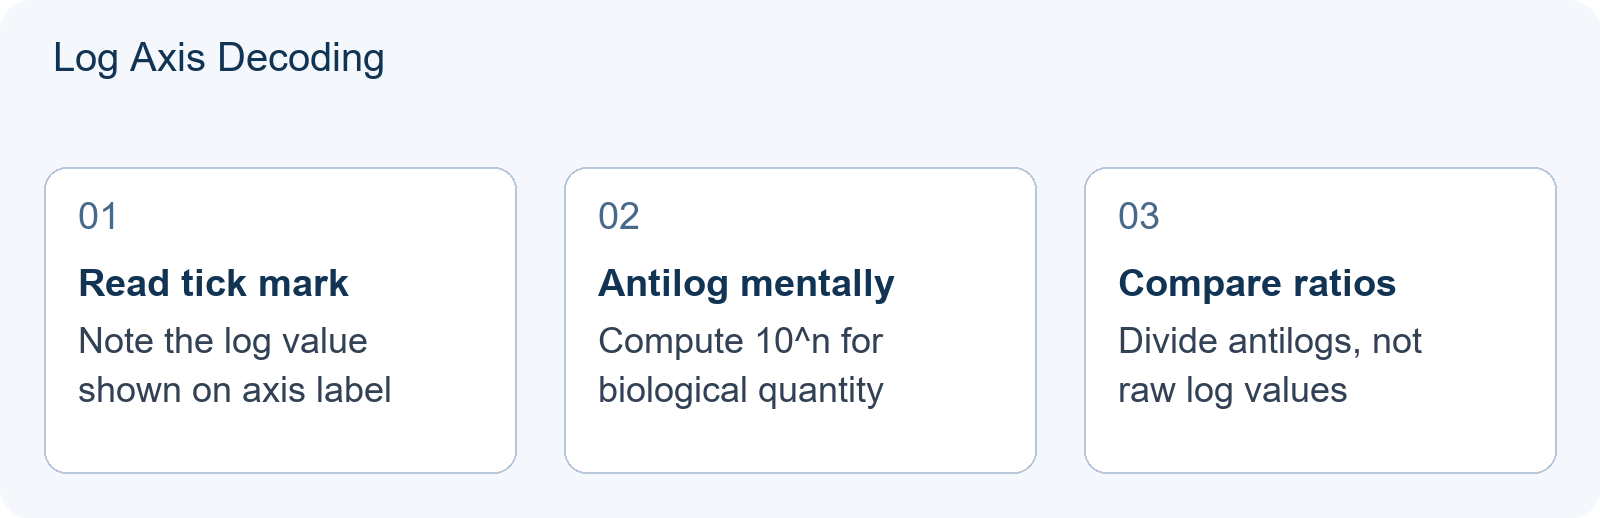
First, decode the y-values. A log10 reading of 3.0 means 10³ = 1,000 cells. A reading of 5.0 means 10⁵ = 100,000 cells. The change in log value is 2.0, which corresponds to a 10² = 100-fold increase in actual population. The slope on the log-linear plot therefore tells us the growth rate constant in the exponential phase.
The time interval is 4 hours. The population multiplied by 100. The hourly multiplication factor is 1001/4 = 100.5 = √10 ≈ 3.16. This is the kind of compact inference that distinguishes careful graph readers from hasty ones.
Key habit: always write the antilog mentally before interpreting biological meaning. The visual slope on the page is not the growth rate; the antilogged ratio is.
Teaching Illustration 2: Where the Shortcut Fails
Scenario: A semi-log plot shows two bacterial growth curves. Curve A rises from 1.0 to 2.0 on the log y-axis. Curve B rises from 3.0 to 4.0 over the same x-interval. A student concludes that both cultures changed by the same amount, so the biological effect is identical.
The error: The student confused equal log differences with equal absolute changes.
Curve A: 101.0 = 10 to 102.0 = 100. That is a 10-fold increase. Curve B: 103.0 = 1,000 to 104.0 = 10,000. Also a 10-fold increase. The ratios match, but if the question had asked for the absolute change in cell count, Curve B added 9,000 cells while Curve A added only 90. The log axis preserves ratio information but erases absolute magnitude.
The deeper trap: on a log axis, a vertical distance of 0.3 means ×2 (because log102 ≈ 0.30). A distance of 1.0 means ×10. Students who eyeball “about the same rise” and conclude “about the same change” will miss that a rise of 0.3 and a rise of 1.0 represent biological effects differing by a factor of five (×2 versus ×10), even though the visual difference looks modest.
Diagnostic Table: Linear vs Log Interpretation
| What you see on axis | Linear reading | Log10 reading |
|---|---|---|
| Equal vertical distances | Equal absolute change | Equal ratio of change |
| Straight line rising | Constant rate (additive) | Constant relative rate (exponential growth) |
| Straight line flat | No change | No change (still true) |
| Distance of 0.30 | 30% of scale (context-dependent) | Exactly ×2 |
| Distance of 1.00 | 100% of scale interval | Exactly ×10 |
Memorise the right-hand column until it is automatic. In timed conditions, you will not have time to derive log properties.
A Targeted Practice Sequence
To build reliable speed, work through this progression:
- Decode only: Given a log axis label, write the antilog for five tick marks without timing yourself. Accuracy first.
- Ratio only: Given two points, state the fold-change. Do not calculate absolute values yet.
- Full interpretation: Combine with the x-axis to find doubling time, generation number, or dilution factor as the question demands.
For broader preparation strategy, including how this skill fits alongside genetics problem-solving and data analysis, see our guide on Setting a Realistic BBO Target: Reading One Cohort’s Award Spread (2026).
Students working on experimental design questions may also find the The BBO Reading Order: Which Biology Textbook to Open First (2026) useful for connecting graph reading to foundational knowledge.
What You Should Be Able to Demonstrate
After working through these patterns, you should be able to:
- Convert any log10 axis value to its real biological quantity instantly
- State whether a straight line on a semi-log plot indicates exponential or linear behaviour
- Recognise when a question is testing absolute versus relative change, and select the correct calculation
- Avoid the common error of treating log-differences as percentage differences
These skills are narrow but high-leverage. One log-axis misreading can cost a full multi-part question in competition conditions.
Preparing for Consultation: What to Bring
If you are discussing preparation with a tutor or advisor, bring a specific example you have already attempted. A productive conversation will cover:
- Which axis was logarithmic and how you identified it
- Your step-by-step calculation of the biological quantity
- Where you hesitated between alternative interpretations
This focused material lets an advisor diagnose whether the gap is in log arithmetic, biological concept, or exam technique—three very different interventions. For students also exploring related competitions, our guide on BBO Past Papers: How to Use Them When Answers Are Not Enough offers a framework for matching practice material to current skill profile.
Frequently Asked Questions
Does the competition ever use natural log instead of log base 10?
Questions typically use log10 because the tick marks correspond to powers of ten that are easy to read. The principles are identical for ln, but the antilog would use e rather than 10. Always check the axis label.
Can I use the same slope interpretation for log-log plots?
No. On a semi-log plot (log y, linear x), a straight line means exponential growth. On a log-log plot (log x, log y), a straight line means a power law relationship. The biological interpretation changes completely.
How do I practice if I have used up all official past papers?
Create your own log-axis questions by taking linear data from biology textbooks and replotting it yourself. The act of constructing the graph builds the reading skill in reverse. Check your reinterpretation against the original numbers.